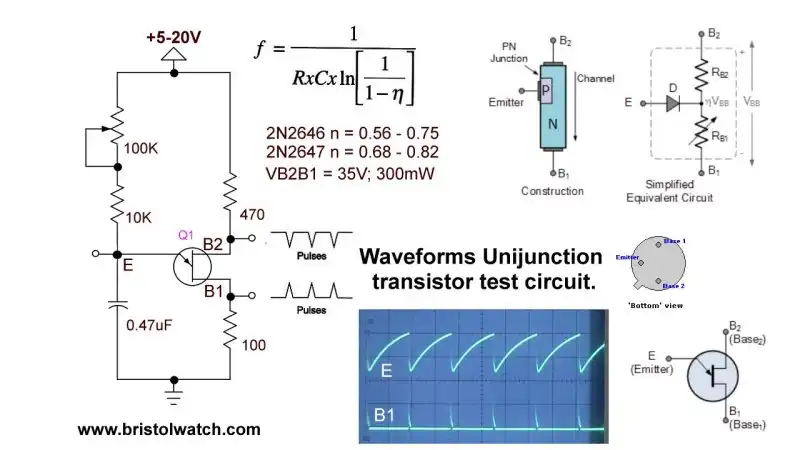
Fig. 1 Unijunction RC circuit, pin connections, and electrical characteristics.
Understanding Unijunction Transistors Theory Operation
by Lewis Loflin
Follow @Lewis90068157
Date 7/25/2021. To see full size image right-click and open image in new tab.
- YouTube:
- Understanding Unijunction Transistors Theory Operation
- Unijunction Transistor SCR Photo Flash Control Circuit
A unijunction transistor is a three pin semiconductor device used for pulse generation for switching on silicon controlled rectifiers. Refer to Fig. 1.
A unijunction transistor belongs more in the SCR family than bipolar transistors. It consists of a single PN junction on an N-type silicon bar.
Note there are versions with a P-type silicon bar but I have never seen one. They were invented in the early 1960s.
Considered obsolete today they have been replaced by programmable unijunction transistors such as the 2N6027. They are still widely used in industrial applications and equipment.
Over 5600 2N2646 and over 7600 2N2647 were in stock at Newark.com (10+ $2.94 each). I bought five 2N2646s as new old stock from Ebay for $6.63.
I concern myself here with the 2N2646 and 2N2647 unijunction transistors - they are very similar.
Fig. 1 (left) shows a typical resistor-capacitor unijunction timing circuit. There are three outputs: negative going pulse on B2 (B stands for base) on the positive rail, positive going pulse on B1 to ground, and emitter E produces a sawtooth waveform.
When the 0.47uF capacitor charges up to the E conduction voltage the capacitor discharges through E and B1 to ground. The capacitor quickly discharges through what is called "negative resistance" where electrical resistance drops with current flow.
To understand how the timing RC circuit operates let's look at the internal operation. That will explain what "n" or the Greek character eta is all about.
This is known as "intrinsic standoff ratio."
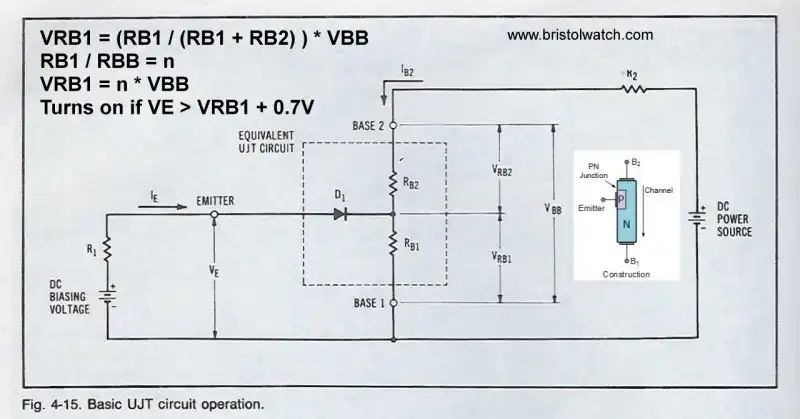
Fig. 2 Unijunction transistor internal voltage resistance characteristics.
Fig. 2 is the theoretical equivalent circuit. Note that E is not in the center of the silicon bar. Thus the resistance from E to B2 (RB2) differs from E to B1 (RB1).
The sum of the two resistances is RBB. The total resistance of RB1 + RB2 is known as the interbase resistance that ranges from 4,700 Ohms to 9100 Ohms.
With a voltage from B2 to B1 (VB2B1) of 11-volts and E at zero volts my test unit measured ~5600 Ohms at 1.9mA of current. Note that conduction from B2 to B1 is constant even with no voltage on E.
Intrinsic standoff ratio is determined the resistance relationship between RB1 and RB2 where n = RB / (RB1 + RB2) is always less than 1.
Typical range of n for the 2N2646 is 0.56 to 0.75; for the 2N2647 is 0.68 to 0.82.
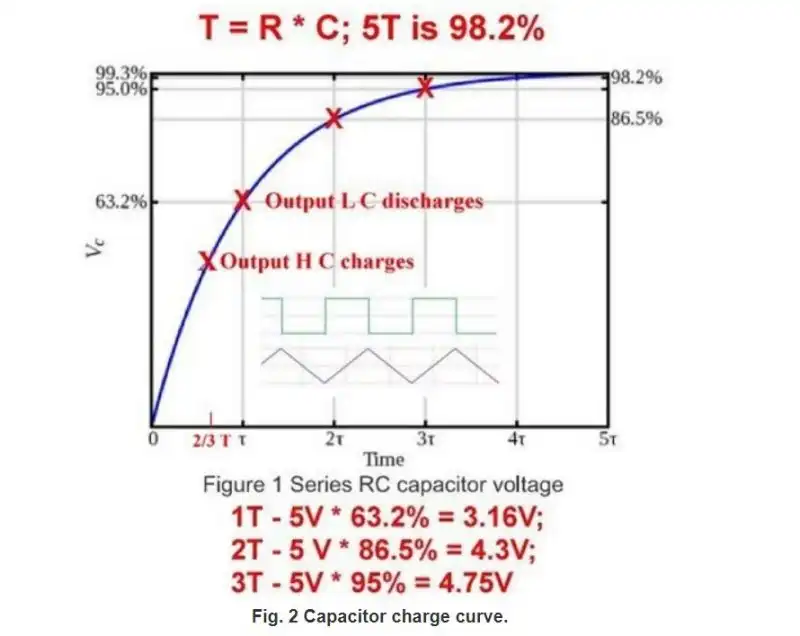
Fig. 3 Typical capacitor-resistor charge curve.
Fig. 3 illustrates a typical RC charge curve that produces a non-linear output. It takes five RC time constants to be considered fully charged.
When the charging voltage reaches the E-B1 turn on voltage the capacitor will discharge though the E diode and B1. The formula (Fig. 2) is the voltage drop across B1 (VB1) plus 0.7 volts for the diode.
VR1 is determined by multiplying the voltage between B2 and B1 (VBB) by n or n * VBB. But there is a little problem I will illustrate below.
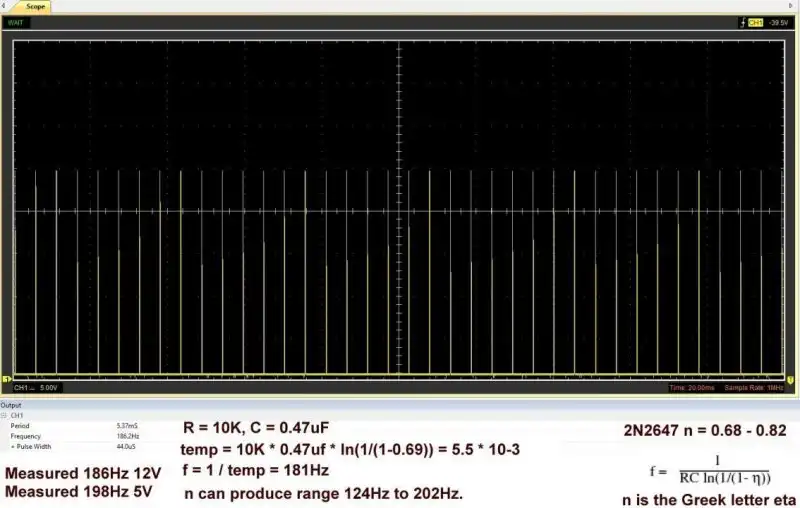
Fig. 4 2N2647 unijunction transistor RC timing calculations.
Fig. 4 is the actual measurements made for the circuit in Fig. 1. C = 0.47uF and R = 10,000 Ohms.
Frequency or f = 1 / (R * C * ln(1 / (1 / (1 - n))). Let me simplify this:
Variable temp = 1 / (1 - 0.69) = 3.2258; the Natural log of temp = ln(3.2258) = 1.17112.
Thus temp = 10,000 Ohms * .00000047 farads * 1.17112 = 5.5 * 10-3.
Thus f = 1 / temp = 1 / 0.0055 = 181 Hertz.
I ran into an immediate problem - the frequency calculations differed from the measured frequency. I did measure my capacitor and resistor before using them.
The problem is n is a range for the 2N2647 from 0.68 to 0.82. This could vary the output frequency calculation from 124Hz to 202Hz. My 2N2647 happened to be 0.69. Be aware of this.
Also note voltage can vary the frequency somewhat. From 5-volts to 20-volts frequency varied less than 20Hz on this RC combination.
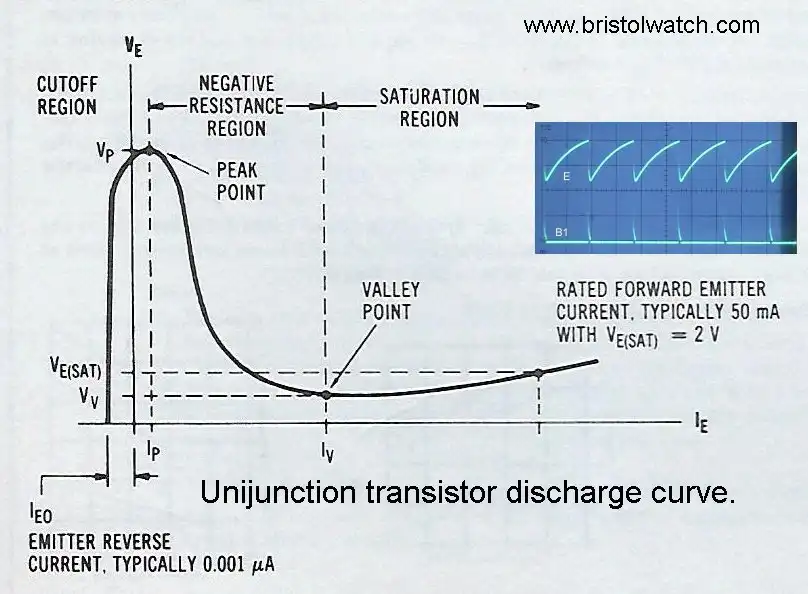
Fig. 5 Unijunction transistor negative resistance curve.
Merriam-Webster defines negative resistance as "a resistance phenomenon (as exhibited by an electric arc or vacuum tube) in which the voltage drop across the circuit decreases as the current increases.."
If I discharged my capacitor though a normal resistor I would get a voltage drop that counteracted the discharge current. I'd get a discharge curve much like charge curve Fig. 3.
In the case of negative resistance there is no or little voltage drop thus the current discharges within a few microseconds.
Referring to Fig. 5 current IE on the emitter is nearly zero until the break over voltage is reached. It will not see the resistance of the diode junction or RB. The resistance is very low until the discharge current drops below the holding current.
Note the capacitor does not discharge fully to zero but closer to about 20% of the supply voltage.
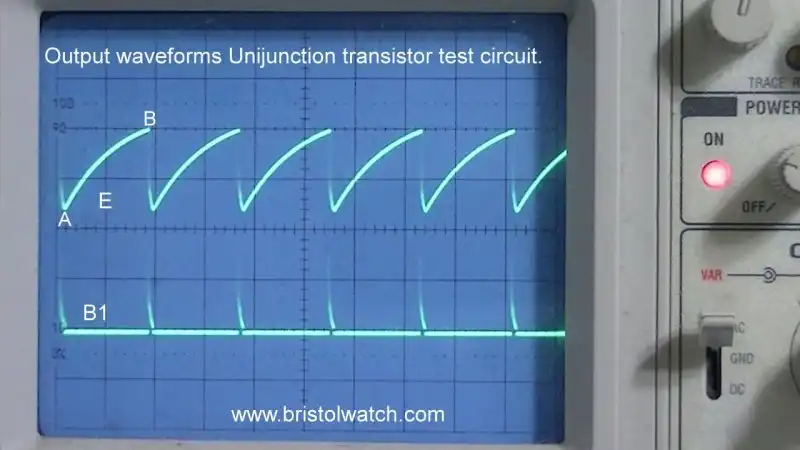
Fig. 6 Output waveforms from unijunction transistor 2N2647 pins B1 and E.
Fig. 6 illustrates the waveforms measured with my oscilloscope. The upper waveform the DC voltage is around 2V at point A. The 0.47uF capacitor begins to charge through the 10K resistor.
Point B is the "break point" where the 0.47uF discharges. This rush of current produces the narrow positive going spike on B1.
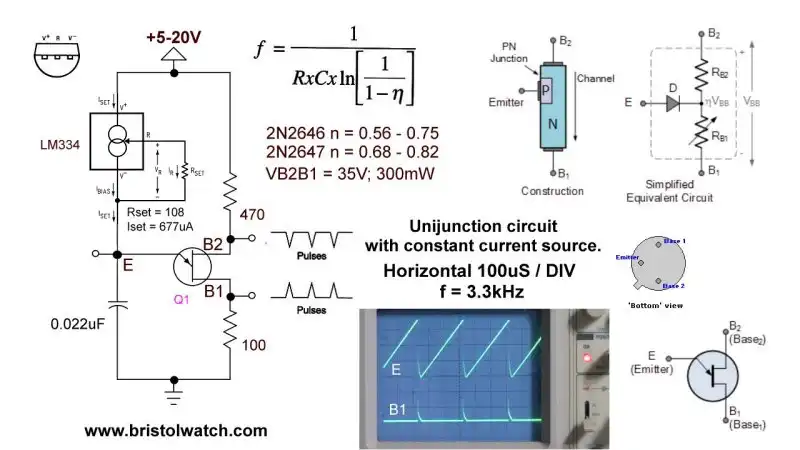 Fig. 7 Unijunction transistor relaxation oscillator uses LM335Z constant current source.
In Fig. 7 I replaced the 10,000 Ohm charge resistor with an LM334Z constant current source. I changed the capacitor 0.022uF. Everything else was left the same.
This produced a very linear charge curve.
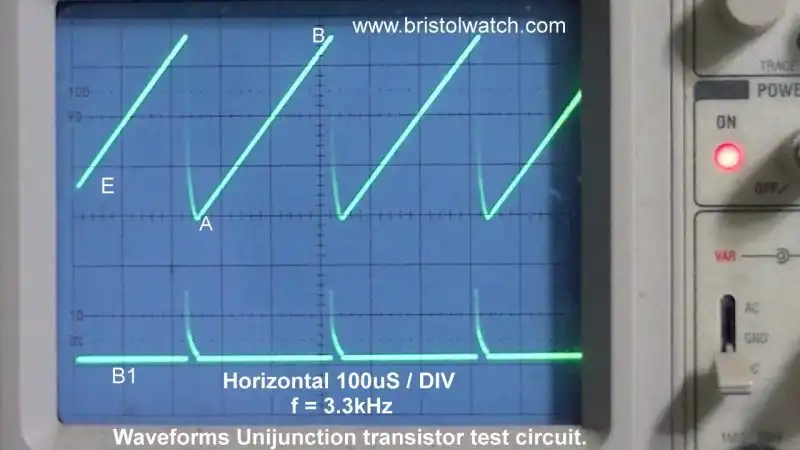 Fig. 8 Unijunction transistor relaxation oscillator LM335Z constant current source waveform.
Fig. 8 is my oscilloscope connected to E and B1. Note the very linear charge curve and the positive going discharge spike on B1.

- Coils for Highly Selective Crystal Radio
- Neon (NE-2) Circuits You Can Build
- Understanding Xenon Flashtubes and Circuits
- Hall Effect Magnetic Switches and Sensors
- Transistor-Zener Diode Regulator Circuits
- Build an Adjustable 0-34 volt power supply with the LM317
- Simple 2 Transistor LED Flasher Circuit
- LM2575 Simple Switching Voltage Regulators
- LM317 Constant Current Source for Lighting LEDs
- IGBT Based High Voltage H-Bridge DC Motor Control
- Arduino Controlled IR2110 Based H-Bridge HV Motor Control
- Understanding Unijunction Transistors Theory Operation
- Arduino Measures Current from Constant Current Source
- Constant Current Source Theory Testing
- Review Ohm's Law for Trouble-Shooting CCS Circuits
- Arduino Power Magnetic Driver Board for Stepper Motors
- Arduino Controlled Power Constant Current Source
- Theory and Operation of Capacitors
Related video to above:
- Measure Current from Constant Current Source with Arduino
- Constant Current Source Multimeter Trouble Shooting
- Ohm's Law Review for Constant Current Source
- Arduino Unipolar Stepper Motor Driver Board with Arduino Code
- Arduino Controlled Constant Current Source
- LM317 Adjustable Current Boost Power Supply
- Constant Current Circuits LM334, LM317
- Build LM317 0-34 Volt Power Supply
- LM334 Constant Current Source with Resistive Sensors
- LM317 High Power Constant Current Source Circuit
- LM317 Constant Current Source Circuits
- Test SCRs and Triacs
- Basic MOSFET Transistor Test Circuits
- High Voltage MOSFET Switching Circuits
- 3 Amp LM741 Op-Amp Constant Current Source
- Current Limiter Testing of Zener Diodes
- Current Limiter for Opto-Coupler Inputs
- LM317 CCS for Light Emitting Diodes
Web site Copyright Lewis Loflin, All rights reserved.
If using this material on another site, please provide a link back to my site.